Note: This is my personal research and learning project on Epidemic Forecasting for Indian Sub Continent. Only Time will tell how true these models are !!!
Hope the readers are liking the COVID19 blog series. However, my personal learning has helped me to debunk my old thoughts and helped me to create few fresh perspectives.
Our Earlier Blogs:
COVID 19 : FACTS & REALTY CHECK - Where I learned about this pandemic - Published on 25th March 2020
COVID 19: NETIZEN REACTIONS - Where tried to show case few examples where netizens try to forward without a fact check. - Published on 29th March 2020
COVID 19: LESSONS FROM “IN” LAND - Our Learning from Kerala - Published on 5th April 2020.
COVID 19 : MEDICAL SCIENCE TO OVERCOME PANDEMIC - My Learning on the Corona Virus on Scientific Terminology. - Published on 15th of April 2020
COVID 19: DEATHS , LOCK DOWN & RECESSION - My Opine along with little research on inter relation about the same - Published on 28th of April 2020.
COVID 19: FEAR STRESS & SUICIDE - My Opine to high light on the stress and suicide in India SubContinent - Published on 10th of May 2020
________________________________________________________________________________________________________
As per rule book of Analytics; I have divided the entire analysis into two parts i.e.;
- Descriptive or Exploratory Analytics
- Predictive or Prescriptive Analytics
Entire Coding has been done in “R” and for reproducible research upto Descriptive Analytics is uploaded on GitHub Account is available at https://github.com/arun0710/COVID19. The Visualisation & Results can be viewed at “https://rpubs.com/arun0710/COVID19” for which the results would be updated on daily basis. { The RPubs file is best viewed on Chrome or Opera }
Descriptive or Exploratory Analysis
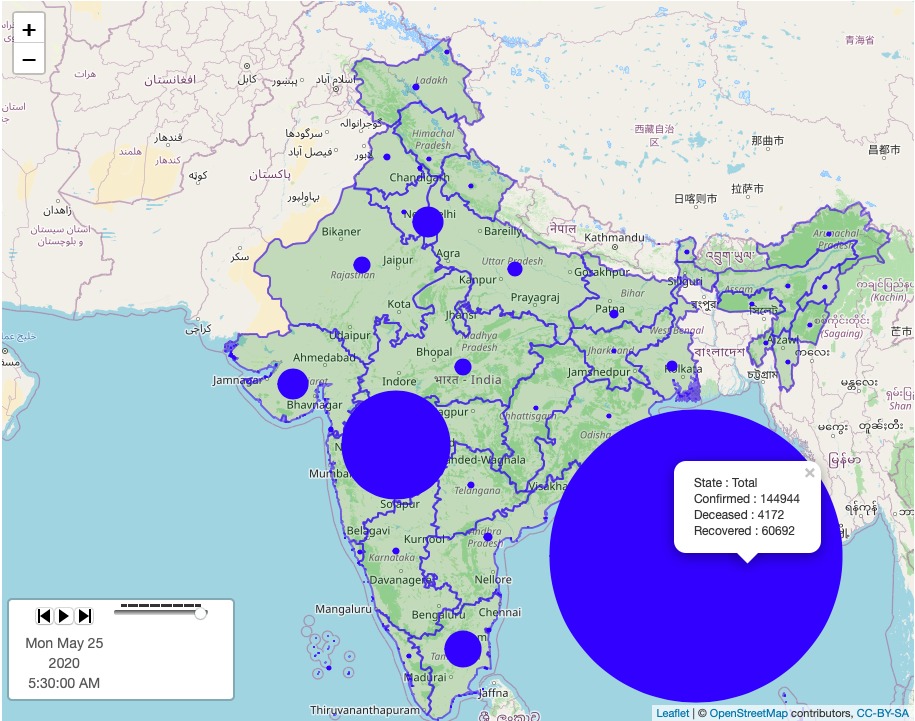
The TimeLine Trend Map will intuitively tell us us where the cases are more and when they started to increase. After Maharashtra being on the top list we can see the it is been followed by Tamil Nadu, Delhi, Gujarath, UP, Rajasthan & Madhya Pradesh.
Disclaimer: Excuse me for the boundaries of the map. These are taken from online sources and the required shape files are uploaded in the github account.
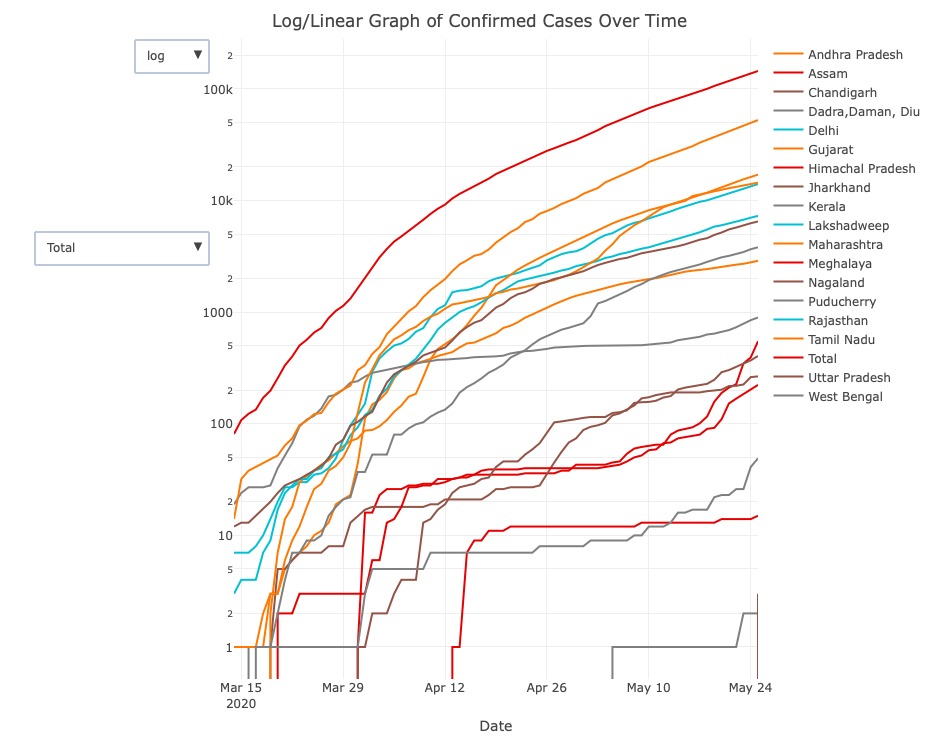
Log/Linear along with all the states the Log Scale & Linear Scale Graph is built primarily which states are effective in terms of controlling the spread. As we heave been listening in the media; it turned out to be Kerala. However, a small uptick is seen for Kerala recently due to the influx of incoming cases in the state from other states & countries.
Also, interestingly Andhra Pradesh states is trying best to flatten the curve.
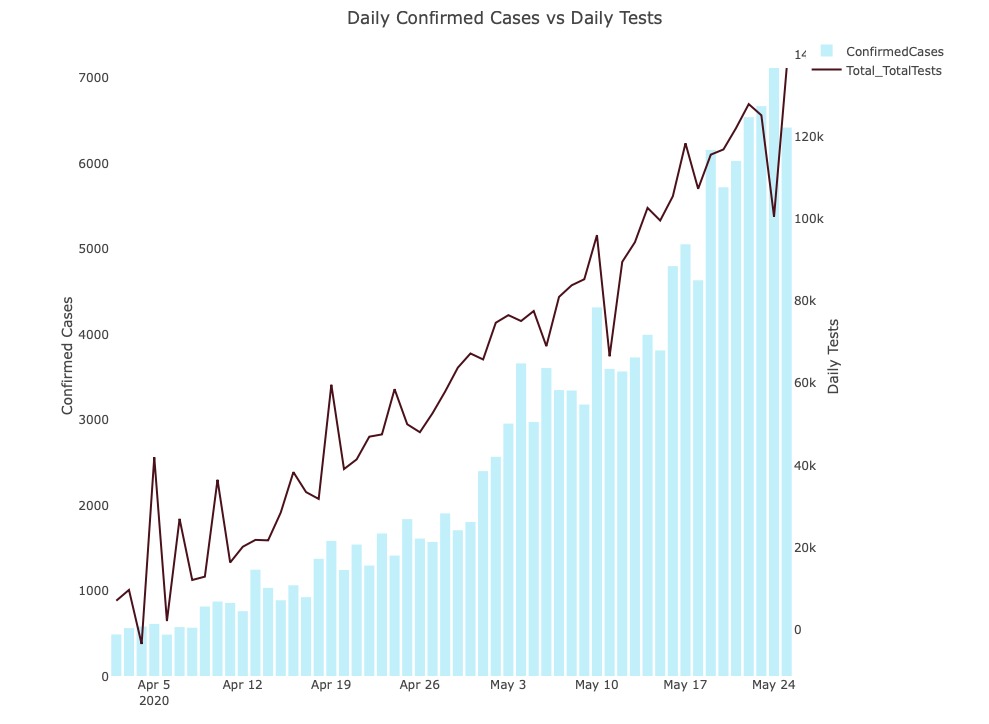
We have been hearing that the testing is low and we need to do more testing in India. Interesting to find that the correlation between daily tests and daily confirmed cases for Over-All India is at 94%. So, it looks like that the only solution as said by WHO is test, trace, isolate & quarantine.
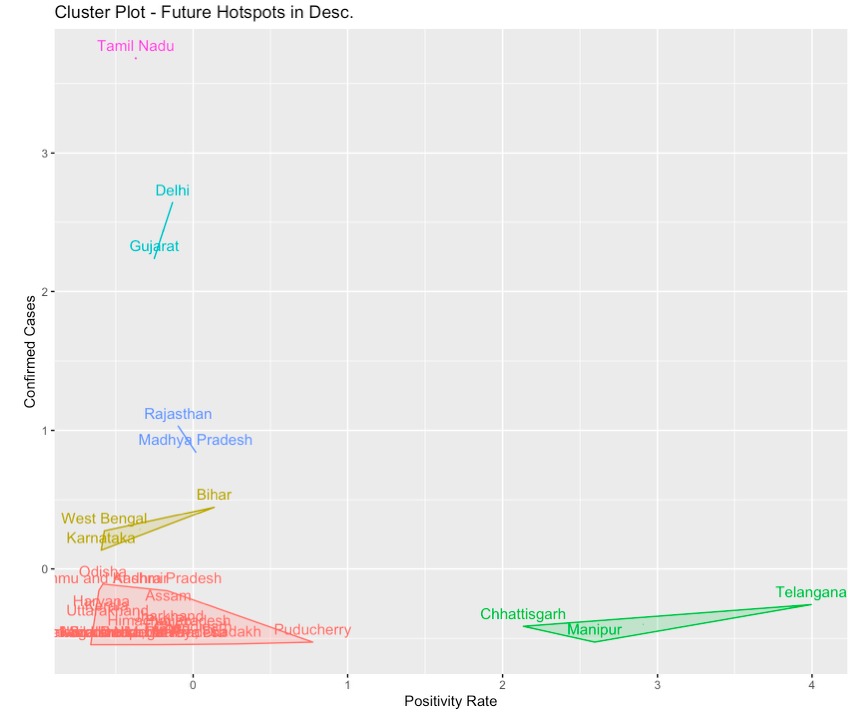
Clustering has been done on two dimensions i.e.; Positivity Rate & Confirmed Cases to identify the cluster of states which can be future hotspots. { Maharashtra has been removed from this cluster analysis }. The Green Cluster on the right hand side are the states which might not be doing testing or not be reporting or data not available but there are cases in last 10 days.
Predictive or Prescriptive Analysis
Epidomology Forecasting and Simulation is a very challenging and there are high chances to be going wrong as we are dealing with many uncertainties.
One such famous model that has gone wrong is the SIRS Model which has been internalised by SUTD Lab for being over optimistic. A paper published on April 30th where you can see past graphs. { Link }

There are few planners who has used the model directly in the Indian Scenario without understanding the details of the algorithm. Which is like directly pulling out the data from the open source data and performing forecasting without any context.
The catch in SIRs model is that it doesn’t take testing into accounting and greater science goes in defining the initial set of variables. However, the model has worked very well with other respiratory diseases where in the disease primarily spreads from symptomatic infections as the initial set of variables are usually can be determined very easily because of symptomatic and verified data.
The Model that I am proposing uses the base of SEIR Model and on top-up will be using the test rates, asymptomatic cases and probable under detection to estimate/simulate the susceptible cases which will be improved as more data is available.
BaseModel:
Here is a base model which uses time-series forecasting on tests and then it regresses on the confirmed cases to forecast the future confirmed cases. As we learnt that higher the tests -> higher the cases.
Below is the output of base model. Since the testing is increasing and hence the confirmed cases there is chance of trend will show upward when considered time series forecasting. So, the forecast is done only for the next 15 days.
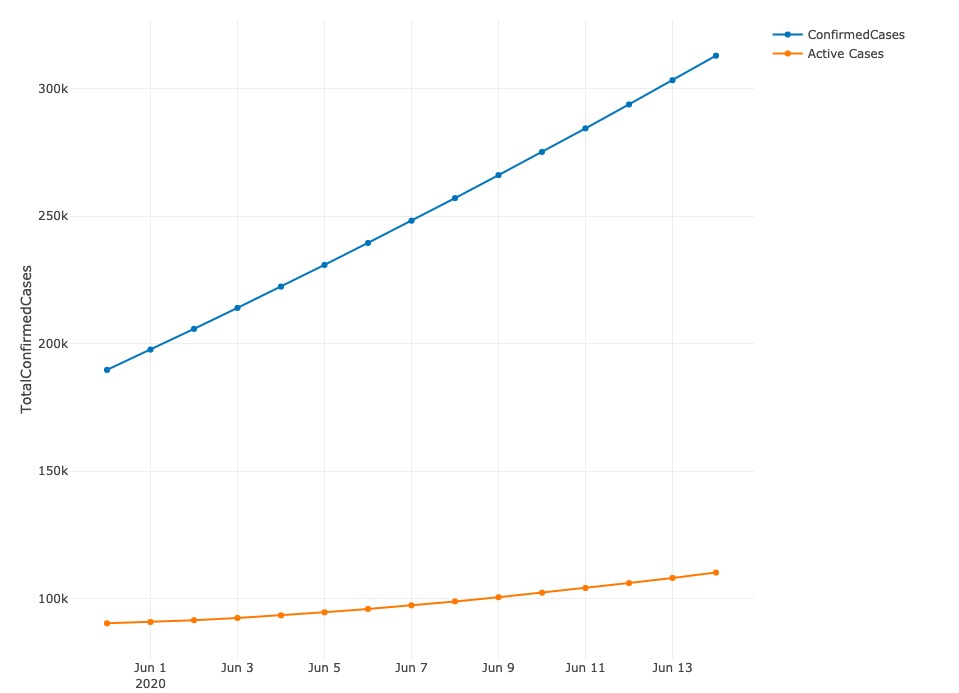
Below is the quick summary of predicted output of the base time series forecasting model; This model gives a good estimate of the probable Active Cases and thus the near requirement or preparedness of the hospitalisation cases as per the current trend of testing. { Assumption of hospitalisation is taken only for severe or critical patients }

ModifiedSIRs-Model:
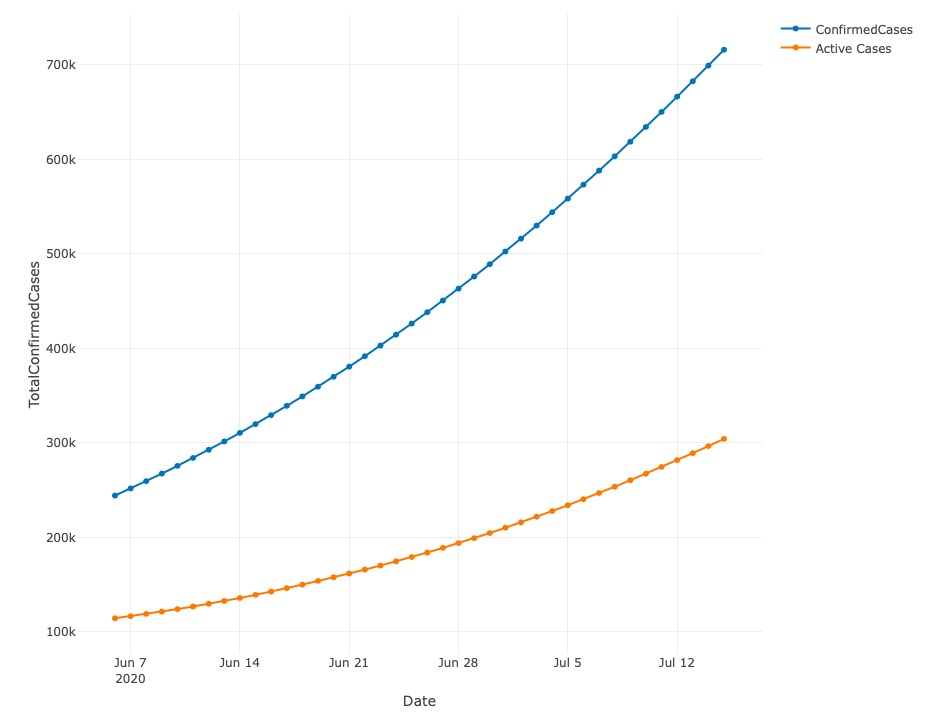
Initial parameters for the SIRS Model for the suspected population is kept for all urban & metro cities and then by past trend it is seen that the testing is 20 times lower than expected based on the simulation trend. { If Testing matches to that of the requirement; considering sufficient beds available for the people; Active Cases curve will flatten itself in 30 days }
As SIRS Model is being considered as over optimistic the initial set variables play a huge role in terms of arriving at the Infected Individuals. Beta, Gamma is adjusted as per testing and undetected cases.
Also, Active Cases is arrived as the present recovery trend instead to using SIRS Model.
Note: There might be few changes as we learn during the pandemic course. The suggested model would certainly undergo changes on weekly basis.

Final Commentary:
Note: Although the total detected cases are in upward; 80% of the present detected cases with our testing rate are asymptomatic.
As mentioned in all previous blogs - Corona will certainly go away it is just a matter of time which can be more quicker with national integrity and global solidarity. Also, earlier couple of blogs on total deaths and suicides are discussed to zoom out of view for a better perspective and comprehension of present situation.
Predicting an END for Pandemic is difficult; as any future outbreak/epidemic is more likely if dealt with wrong hands. So, it is high time to adjust with the new normal with lockdown mindset. And further as we are moving to unlock 1.0 to save our own livelihoods it is fundamental necessity to practice the new social norms to save our own people at-least till the availability of vaccine.
We have learnt that there are only three ways to control this pandemic in India
- Peoples’ Participation
- Testing, Testing & More Testing
- Tracing, Isolation & Quartine
https://www.erinbromage.com/post/the-risks-know-them-avoid-them a viral blog post which is on Whatsapp and twitter. Please go through as per your convenience.

.tmb-1024v.png?sfvrsn=afa995ff_1)