College Majors and AI Exposure
The jobs least exposed to AI pay the most, yet only about 1 in 40 graduates heads toward them.
0. Introduction
This week’s dataset asks which college majors are safest from AI, and whether the safe ones pay. It joins College Scorecard salaries, the AI Occupational Exposure (AIOE) index and a crosswalk from majors to the occupations their graduates enter.
Instead of scoring majors directly, I started from the jobs. I grouped 453 occupations into three clusters with k-means on their overall, language and image AI exposure, then asked where each major’s graduates land. Everything is done in R with ggplot2, ggforce and gt.
1. How I Grouped the Jobs
1.1. Clustering Occupations by AI Exposure
Each occupation gets a salary proxy, which is the median salary four years after graduation of the majors that feed into it, weighted by their number of graduates. K-means then splits the occupations into three groups, ordered Low, Mid and High by their average exposure.
1.2. Picking Spotlight Majors
A major belongs to the cluster where most of its jobs sit. I kept majors with more than 75% of their jobs in that one cluster, then picked the three largest by graduates in each cluster to circle on the chart.
2. Plots
2.1. Where AI Meets the Job Market
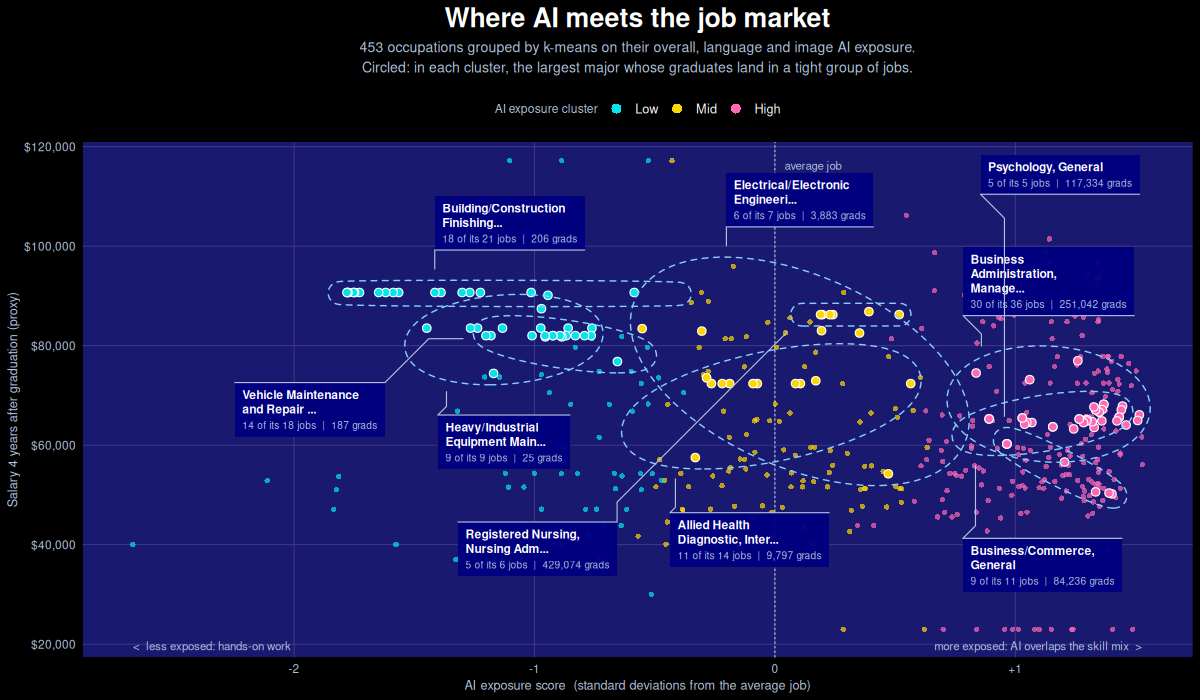
Findings:
- Pay overlaps: the three clusters’ pay ranges overlap a lot, so AI exposure on its own says little about salary.
- Low exposure: construction finishing, vehicle maintenance and heavy-equipment work sit at the far left, with salaries around $80k–$90k.
- High exposure: business administration, general psychology and general business send graduates into jobs where AI overlaps most with the skill mix.
- Where graduates go: most graduates head into mid- and high-exposure jobs, as the table below also shows. High exposure doesn’t mean AI will replace these jobs; it means they will change.
2.2. Three Ways AI Meets Work
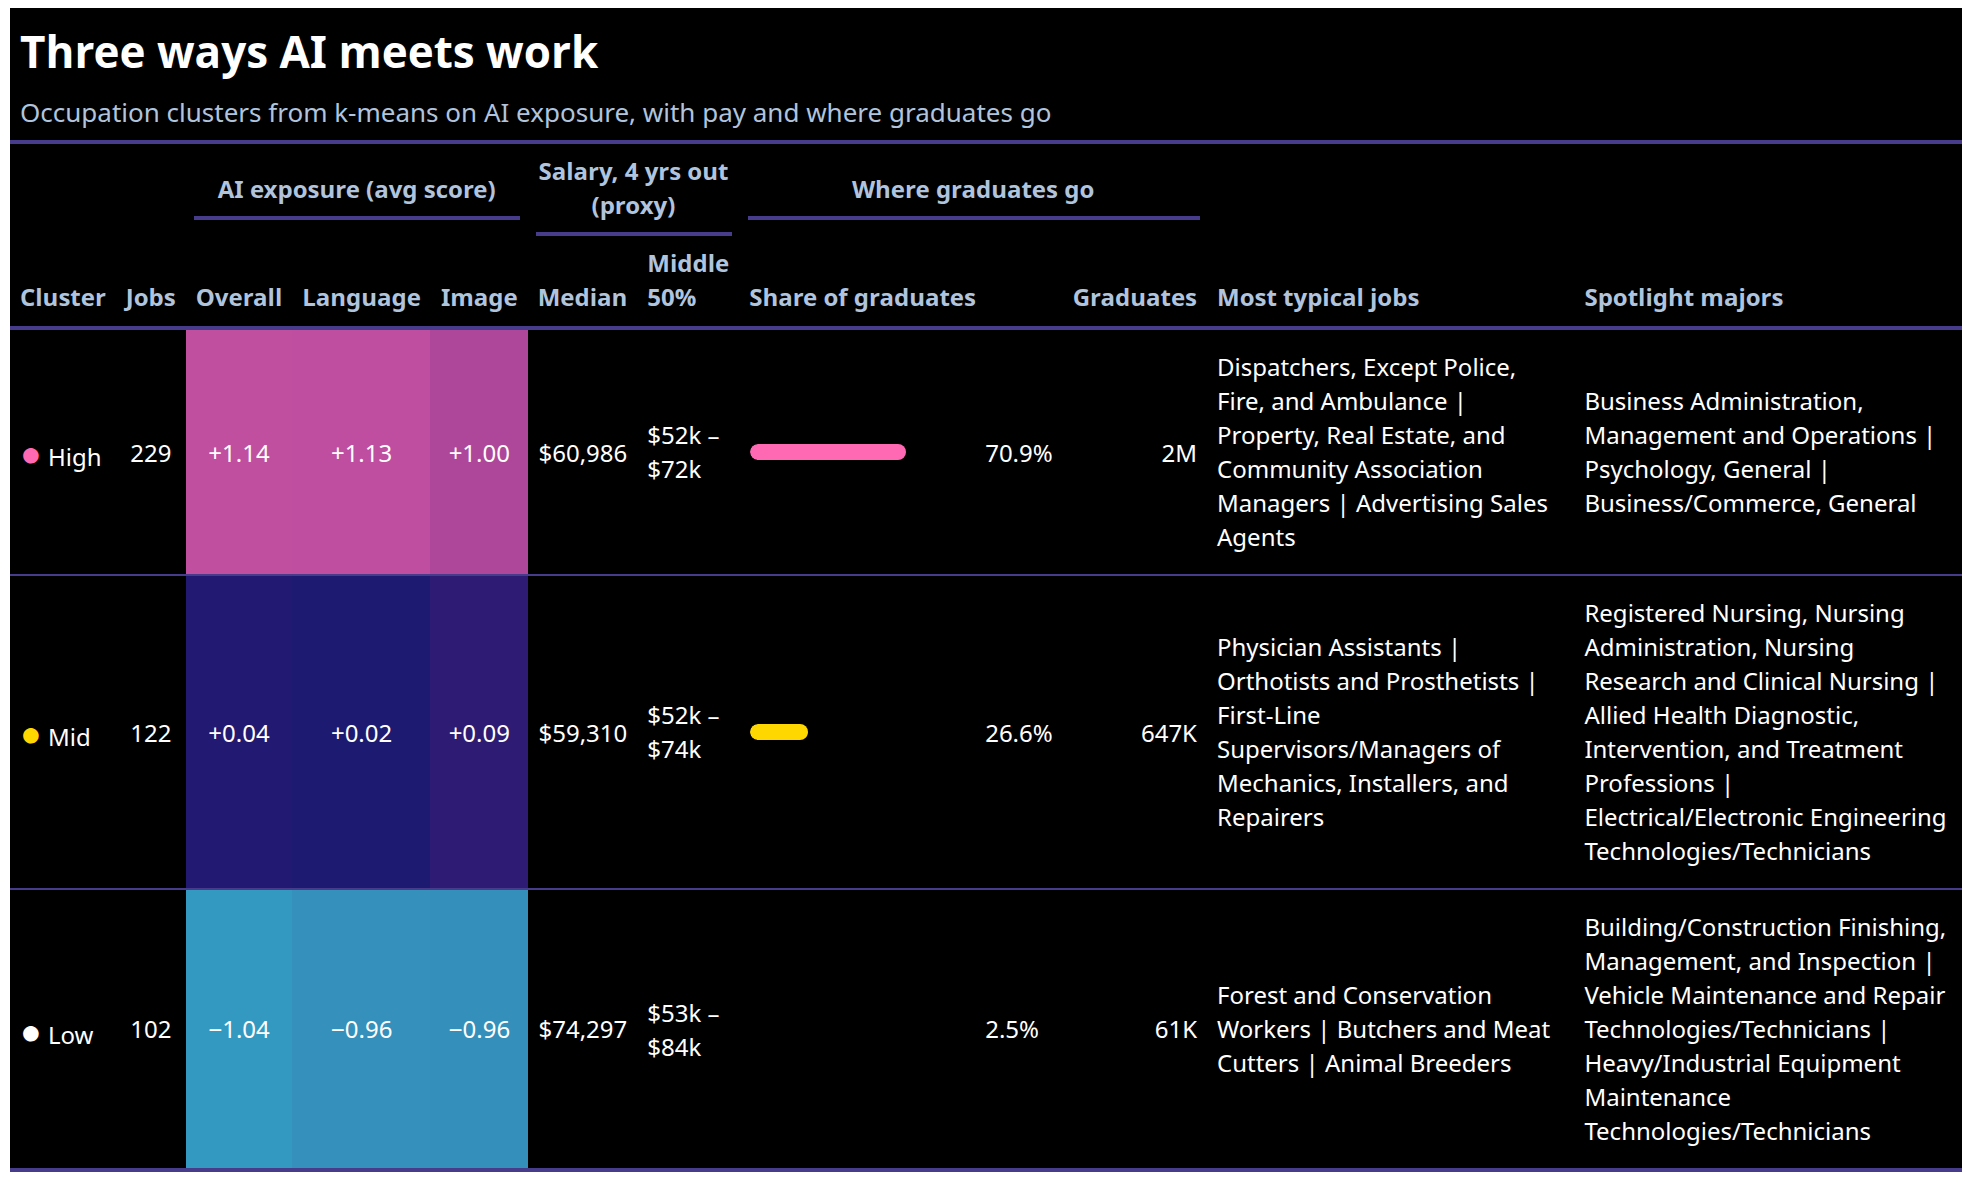
Findings:
- Low exposure pays best: the 102 low-exposure jobs have the highest median salary proxy, $74,297, against about $61,000 for the high cluster and $59,000 for the mid cluster.
3. References
- College Scorecard field-of-study data, U.S. Department of Education
- AI Occupational Exposure (AIOE) index, Felten, Raj and Seamans (2021)
- NCES/BLS CIP-to-SOC crosswalk
- ggforce
geom_mark_ellipse()for the circled majors
One week down. See the other charts in the gallery, or leave a comment below.
← Back to the gallery