Loading Libraries
library(tidyverse)
library(jpeg)
library(grid)India
Arun Koundinya Parasa
July 22, 2024
I have not written any inferences in this blog. I will be sharing my opinions along with my inferences in my personal blog. Stay Tuned!!!
This particular visualization is done on R to visualize the data in shape files.
data <- readr::read_csv('districtwise-crime-against-women.csv')

## For Loading Shape Files
# https://projects.datameet.org/maps/#state-boundaries
INDIA_MAP = st_read("States/Admin2.shp")

## Indian Census Population from Wikipedia
url <- "https://en.wikipedia.org/wiki/List_of_states_and_union_territories_of_India_by_population"
webpage <- read_html(url)
tables <- html_nodes(webpage, "table")
population_table <- html_table(tables[[2]], fill = TRUE)
rm(tables,webpage,url)## Creating Category for Easier Consumption for Reader
data |>
mutate(
year_yr = lubridate::year(data$year)
) |>
pivot_longer(
cols = c(8:29),
names_to = "Category",
values_to = "Count"
) |>
mutate(
Category_Update = case_when(
Category %in% c("dowry_deaths","abetment_to_suicide_of_women","cruelty_by_husband_or_his_relatives",
"dowry_prohibition","protection_of_women_from_domestic_violence_act") ~ "Domestic Violence",
Category %in% c("miscarriage","acid_attack","attempt_to_acid_attack",
"kidnapping_and_abduction_of_women_total","insult_to_the_modesty_of_women") ~ "Harassment",
Category %in% c("murder_with_rape_or_gang_rape","assault_on_women_with_intent_to_outrage_her_modesty",
"indecent_representation_of_women_prohibition") ~ "Sexual Harassment",
Category %in% c("selling_of_minor_girls","buying_of_minor_girls","prot_of_children_frm_sexual_viol_girl_child_victims") ~ "POCSO",
Category %in% c("human_trafficking","rape","attempt_to_commit_rape","immoral_traffic_prevention_act_total") ~ "Sexual Violence",
Category %in% c("cyber_crimes_or_infor_tech_women_centric_crimes") ~ "Cyber Crime",
Category %in% c("total_crime_against_women") ~ "Total",
TRUE ~ "Others"
)
) -> Crime_Data
## Taking only subset for specific years
Crime_Data |>
filter(
year_yr %in% c(2018,2019,2020,2021)
) -> Crime_Data_2018_21
## Creating CrimeData Over All Summary
Crime_Data_2018_21_Overall_Summary <-
Crime_Data_2018_21 |>
group_by(year_yr,Category_Update) |>
summarise(TotalCrimes = sum(Count), .groups = "drop") |>
filter (
Category_Update == "Total"
) |>
mutate(
CrimesPerDay = round(TotalCrimes/365,0),
CrimesPerDayPerState = round(round(TotalCrimes/365,0)/36,0)
)
## Creating CrimeData Summary Year Wise
Crime_Data_2018_21_Overall <-
Crime_Data_2018_21 |>
group_by(year_yr,Category_Update) |>
summarise(TotalCrimes = sum(Count), .groups = "drop") |>
filter (
Category_Update != "Total"
) |>
mutate(
CrimesPerDay = round(TotalCrimes/365,0),
CrimesPerDayPerState = round(round(TotalCrimes/365,0)/36,0)
)
## Creating CrimeData Summary Year Wise and State Wise
Crime_Data_2018_21_State <-
Crime_Data_2018_21 |>
group_by(year_yr,state_name,Category_Update) |>
summarise(TotalCrimes = sum(Count), .groups = "drop") |>
filter (
Category_Update != "Total"
) |>
mutate(
CrimesPerDay = round(TotalCrimes/365,0),
NAME_1 = case_when(
state_name == "Andaman And Nicobar Islands" ~ "Andaman & Nicobar",
state_name == "The Dadra And Nagar Haveli And Daman And Diu" ~ "Dadra and Nagar Haveli and Daman and Diu",
state_name == "Jammu And Kashmir" ~ "Jammu & Kashmir",
TRUE ~ state_name
)
)
## Loading Indian Map with State Boundaries from shape files downloaded from https://gadm.org/download_country.html#google_vignette
india_map = data.frame(INDIA_MAP)
india_map <-
india_map |>
select(NAME_1 = `ST_NM`,geometry=`geometry`)
## Creattion of Population Data from Loaded Wikipedia page
population_table <- population_table[c(2:37),c(2,3)]
population_table |>
select(State = `State or Union Territory`, Population = `Population[18][19]`) |>
mutate(
Population = as.numeric(gsub(",", "", Population)),
State = trimws(State),
PopulationPer1Lakh = round(Population/100000,0),
PopulationPer1Lakh = case_when(
State == "Andhra Pradesh" ~ 496,
TRUE ~ PopulationPer1Lakh
)
) |>
mutate(
NAME_1 = case_when(
State == "Andaman and Nicobar Islands" ~ "Andaman & Nicobar",
State == "Dadra and Nagar Haveli and Daman and Diu" ~ "Dadra and Nagar Haveli and Daman and Diu",
State == "Jammu and Kashmir" ~ "Jammu & Kashmir",
State == "Manipur[d]" ~ "Manipur",
TRUE ~ State
)
) |>
select(NAME_1 = `NAME_1`, PopuplationPerLakh = `PopulationPer1Lakh`) -> Population# Plot1 - Bar Chart
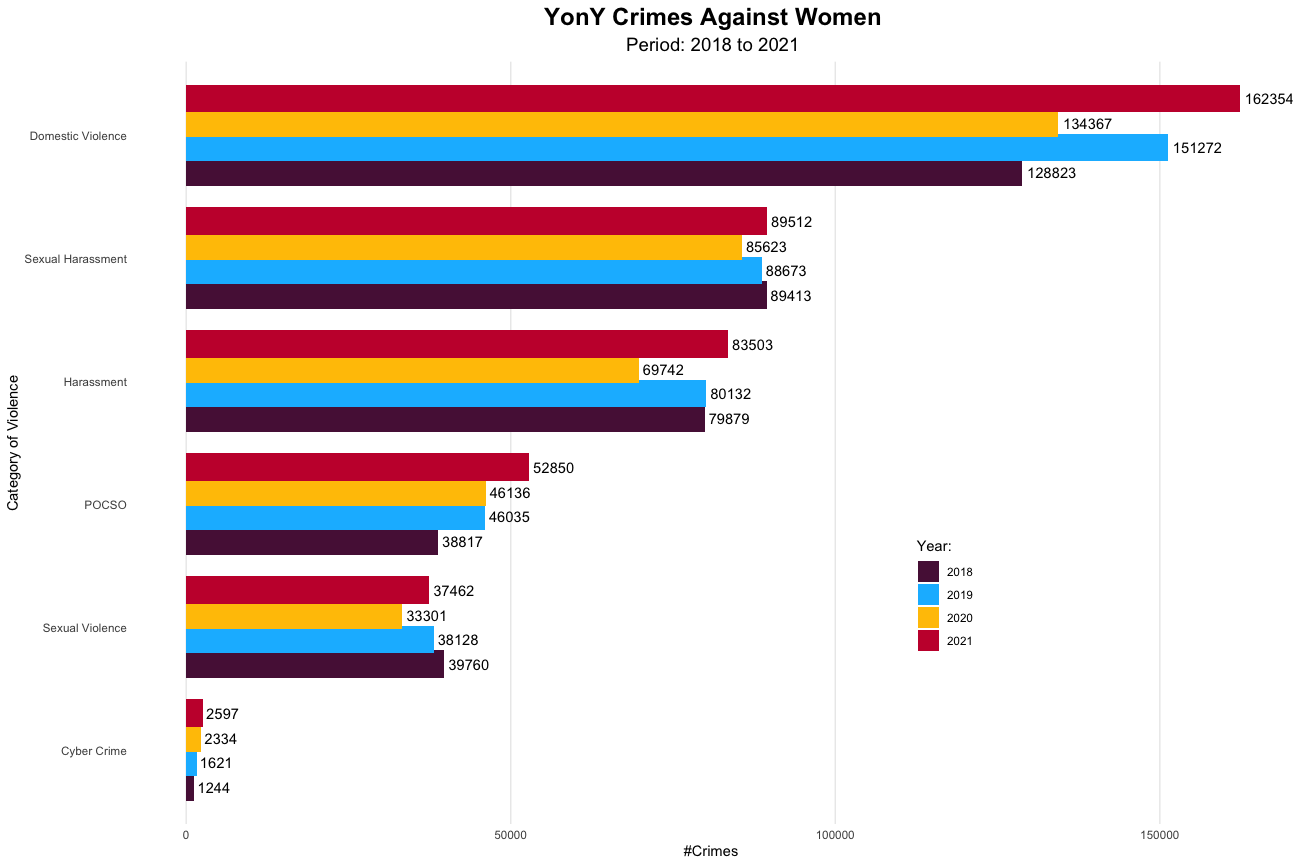
category_order <- c("Cyber Crime","Sexual Violence","POCSO","Harassment","Sexual Harassment","Domestic Violence")
Crime_Data_2018_21_Overall |>
ggplot(aes(x = factor(Category_Update, levels = category_order), y = TotalCrimes,fill = as.character(year_yr))) +
geom_bar(stat = "identity",position = position_dodge(width = 0.8)) +
geom_text(aes(label = TotalCrimes), position = position_dodge(width = 0.8), hjust = -0.1, color ="black") +
coord_flip() +
scale_fill_manual(values = c("#581845", "#11BBFF", "#FFC300","#C70039")) +
theme_minimal() +
labs(
x = "Category of Violence",
y = "#Crimes ",
title = "YonY Crimes Against Women",
subtitle = "Period: 2018 to 2021"
) +
guides(
fill = guide_legend(title = "Year:")
) +
theme(
legend.position = c(0.7,0.3),
panel.grid.minor.y = element_blank(),
panel.grid.minor.x = element_blank(),
panel.grid.major.y = element_blank(),
plot.title = element_text(hjust = 0.5, size = 18, face = "bold"),
plot.subtitle = element_text(hjust = 0.5, size = 14)
) 
# Plot 2A Data Preperation
Crime_Data_2018_21_State_Summary <-
  Crime_Data_2018_21_State |>
  group_by(year_yr,NAME_1) |>
  summarise(Total_Crimes = sum(TotalCrimes),.groups = "drop") |>
  pivot_wider(
    names_from = year_yr,
    values_from = Total_Crimes
    )

# Plot 2B Data Preperation
Crime_Data_2018_21_State_Summary2 <-
  Crime_Data_2018_21_State |>
  group_by(year_yr,NAME_1) |>
  summarise(Total_Crimes = sum(TotalCrimes),.groups = "drop")
Crime_Data_2018_21_State_Summary2 <- merge(Crime_Data_2018_21_State_Summary2,Population,by.x = "NAME_1",by.y = "NAME_1",all.x = TRUE)
Crime_Data_2018_21_State_Summary2 |>
  mutate(
    CrimesPer1LakhPop = round(Total_Crimes/PopuplationPerLakh,1)
  ) |>
  select(NAME_1 = `NAME_1`, year_yr = `year_yr`,CrimesPer1LakhPop=`CrimesPer1LakhPop`) |>
  pivot_wider(
    names_from = year_yr,
    values_from = CrimesPer1LakhPop
  ) -> Crime_Data_2018_21_State_Summary2

# Plot 2A Data Preperation
india_map_state <- merge(india_map,Crime_Data_2018_21_State_Summary,by.x = "NAME_1",by.y = "NAME_1",all.x = TRUE)
india_map_state = st_as_sf(india_map_state)

# Plot 2B Data Preperation
india_map_state_pc <- merge(india_map,Crime_Data_2018_21_State_Summary2,by.x = "NAME_1",by.y = "NAME_1",all.x = TRUE)
india_map_state_pc = st_as_sf(india_map_state_pc)

# Plot 2A 2018 Plot
india_map_state |>
  ggplot() +
  geom_sf(aes(fill = `2018`), color = "black") +
  scale_fill_viridis_c(option = "plasma", na.value = "grey50") +
  theme_minimal() +
  labs(
    title = "Heatmap of Total Crimes in 2018",
    subtitle = "State-wise distribution"
  ) +
  theme(
    legend.position = c(0.8,0.2),
    legend.key.size = unit(0.5, "cm"),
    legend.text = element_text(size = 7)
  ) -> plot_2018

# Plot 2A 2019 Plot
india_map_state |>
  ggplot() +
  geom_sf(aes(fill = `2019`), color = "black") +
  scale_fill_viridis_c(option = "plasma", na.value = "grey50") +
  theme_minimal() +
  labs(
    title = "Heatmap of Total Crimes in 2019",
    subtitle = "State-wise distribution"
  ) +
  theme(
    legend.position = c(0.8,0.2),
    legend.key.size = unit(0.5, "cm"),
    legend.text = element_text(size = 7)
  ) -> plot_2019

# Plot 2A 2020 Plot
india_map_state |>
  ggplot() +
  geom_sf(aes(fill = `2020`), color = "black") +
  scale_fill_viridis_c(option = "plasma", na.value = "grey50") +
  theme_minimal() +
  labs(
    title = "Heatmap of Total Crimes in 2020",
    subtitle = "State-wise distribution"
  ) +
  theme(
    legend.position = c(0.8,0.2),
    legend.key.size = unit(0.5, "cm"),
    legend.text = element_text(size = 7)
  ) -> plot_2020

# Plot 2A 2021 Plot
india_map_state |>
  ggplot() +
  geom_sf(aes(fill = `2021`), color = "black") +
  scale_fill_viridis_c(option = "plasma", na.value = "grey50") +
  theme_minimal() +
  labs(
    title = "Heatmap of Total Crimes in 2021",
    subtitle = "State-wise distribution"
  ) +
  theme(
    legend.position = c(0.8,0.2),
    legend.key.size = unit(0.5, "cm"),
    legend.text = element_text(size = 7)
  ) -> plot_2021


# Combine the plots into a 2x2 grid
combined_plot <- (plot_2018 | plot_2019) / (plot_2020 | plot_2021)

# Display the combined plot
combined_plot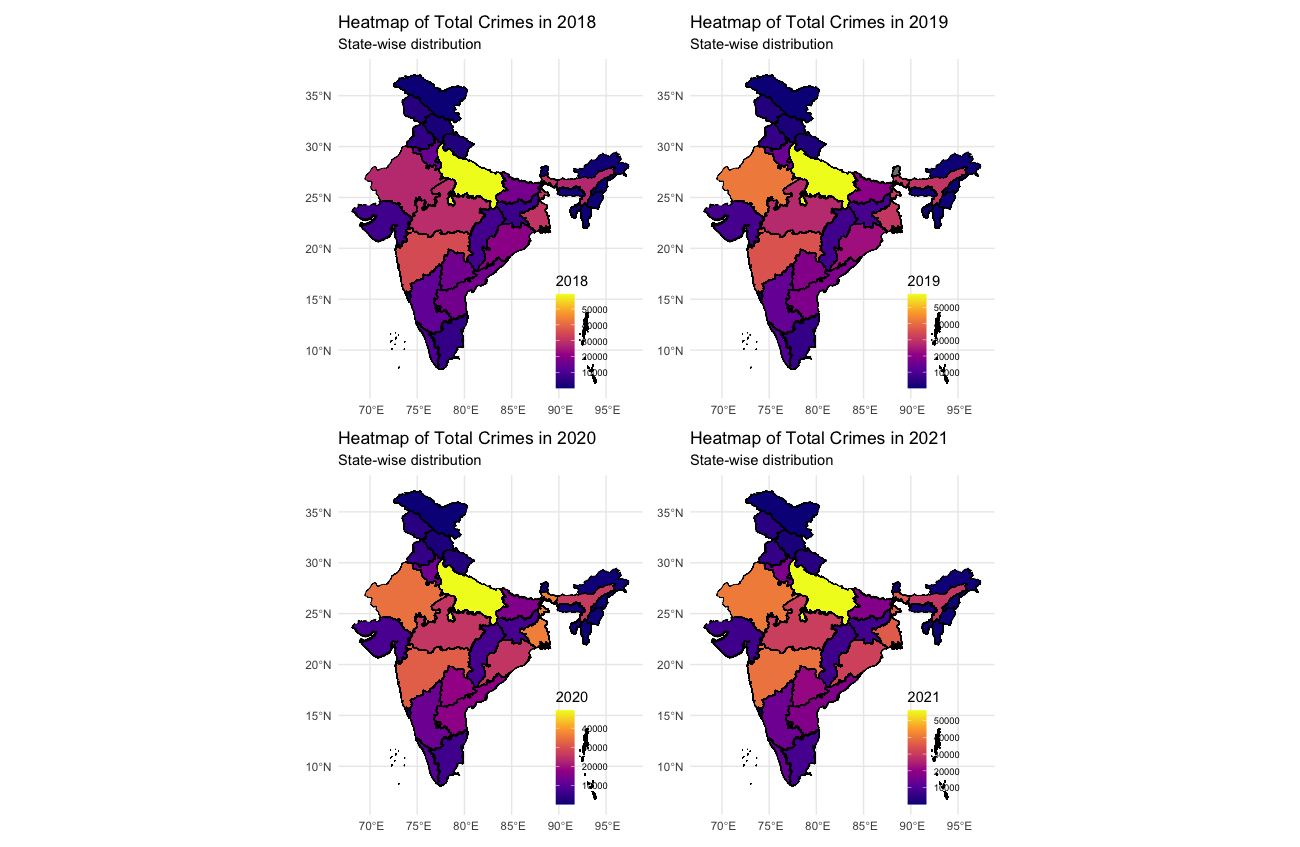
# Plot 2B 2018 Plot
india_map_state_pc |>
  ggplot() +
  geom_sf(aes(fill = `2018`), color = "black") +
  scale_fill_viridis_c(option = "plasma", na.value = "grey50") +
  theme_minimal() +
  labs(
    title = "Heatmap of Total Crimes in 2018",
    subtitle = "Crimes Per 1 Lac of Population"
  ) +
  theme(
    legend.position = c(0.8,0.2),
    legend.key.size = unit(0.5, "cm"),
    legend.text = element_text(size = 7)
  ) -> plot_2018_pc

# Plot 2B 2019 Plot
india_map_state_pc |>
  ggplot() +
  geom_sf(aes(fill = `2019`), color = "black") +
  scale_fill_viridis_c(option = "plasma", na.value = "grey50") +
  theme_minimal() +
  labs(
    title = "Heatmap of Total Crimes in 2019",
    subtitle = "Crimes Per 1 Lac of Population"
  ) +
  theme(
    legend.position = c(0.8,0.2),
    legend.key.size = unit(0.5, "cm"),
    legend.text = element_text(size = 7)
  ) -> plot_2019_pc

# Plot 2B 2020 Plot
india_map_state_pc |>
  ggplot() +
  geom_sf(aes(fill = `2020`), color = "black") +
  scale_fill_viridis_c(option = "plasma", na.value = "grey50") +
  theme_minimal() +
  labs(
    title = "Heatmap of Total Crimes in 2020",
    subtitle = "Crimes Per 1 Lac of Population"
  ) +
  theme(
    legend.position = c(0.8,0.2),
    legend.key.size = unit(0.5, "cm"),
    legend.text = element_text(size = 7)
  ) -> plot_2020_pc

# Plot 2B 2021 Plot
india_map_state_pc |>
  ggplot() +
  geom_sf(aes(fill = `2021`), color = "black") +
  scale_fill_viridis_c(option = "plasma", na.value = "grey50") +
  theme_minimal() +
  labs(
    title = "Heatmap of Total Crimes in 2021",
    subtitle = "Crimes Per 1 Lac of Population"
  ) +
  theme(
    legend.position = c(0.8,0.2),
    legend.key.size = unit(0.5, "cm"),
    legend.text = element_text(size = 7)
  ) -> plot_2021_pc


# Combine the plots into a 2x2 grid
combined_plot_pc <- (plot_2018_pc | plot_2019_pc) / (plot_2020_pc | plot_2021_pc)

# Display the combined plot
combined_plot_pc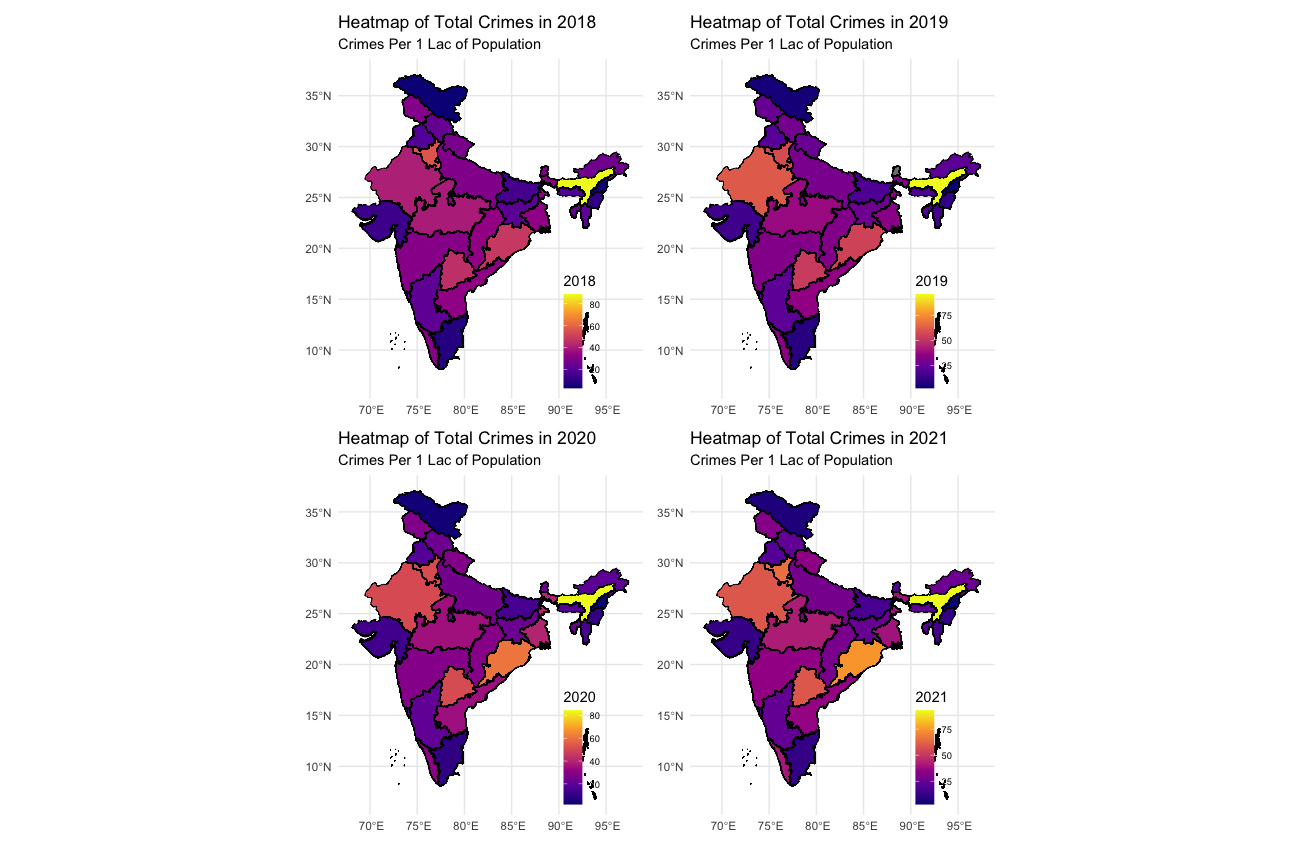
# Plot 3A Data Preperation
Crime_Data_21_State_Summary <- subset(Crime_Data_2018_21_State, Crime_Data_2018_21_State$year_yr == 2021)
Crime_Data_21_State_Summary <- Crime_Data_21_State_Summary[,c("NAME_1","TotalCrimes","Category_Update")]
Crime_Data_21_State_Summary <- Crime_Data_21_State_Summary |>
  pivot_wider(
    names_from = Category_Update,
    values_from = TotalCrimes
  )

# Plot 3B Data Preperation
Crime_Data_21_State_Summary_PC <- subset(Crime_Data_2018_21_State, Crime_Data_2018_21_State$year_yr == 2021)
Crime_Data_21_State_Summary_PC <- Crime_Data_21_State_Summary_PC[,c("NAME_1","TotalCrimes","Category_Update")]
Crime_Data_21_State_Summary_PC <- merge(Crime_Data_21_State_Summary_PC,Population,by.x = "NAME_1",by.y = "NAME_1",all.x = TRUE)
Crime_Data_21_State_Summary_PC |>
  mutate(
    CrimesPer1LakhPop = round(TotalCrimes/PopuplationPerLakh,1)
  ) |>
  select(NAME_1 = `NAME_1`, Category_Update = `Category_Update`,CrimesPer1LakhPop=`CrimesPer1LakhPop`) |>
  pivot_wider(
    names_from = Category_Update,
    values_from = CrimesPer1LakhPop
  ) -> Crime_Data_21_State_Summary_PC


# Plot 3A Data Preperation
india_map_state_new <- merge(india_map,Crime_Data_21_State_Summary,by.x = "NAME_1",by.y = "NAME_1",all.x = TRUE)
india_map_state_new = st_as_sf(india_map_state_new)

# Plot 3B Data Preperation
india_map_state_new_pc <- merge(india_map,Crime_Data_21_State_Summary_PC,by.x = "NAME_1",by.y = "NAME_1",all.x = TRUE)
india_map_state_new_pc = st_as_sf(india_map_state_new_pc)


# Plot 3A Plots by Category
india_map_state_new |>
  ggplot() +
  geom_sf(aes(fill = `Domestic Violence`), color = "black") +
  scale_fill_viridis_c(option = "plasma", na.value = "grey50") +
  theme_void() +
  labs(
    title = "Domestic Violence Crimes in 2021",
    subtitle = "State-wise distribution"
  ) +
  theme(
    legend.position = c(0.6,0.2),
    legend.key.size = unit(0.4, "cm"),
    legend.text = element_text(size = 7)
  ) -> plot_dv

india_map_state_new |>
  ggplot() +
  geom_sf(aes(fill = `Harassment`), color = "black") +
  scale_fill_viridis_c(option = "plasma", na.value = "grey50") +
  theme_void() +
  labs(
    title = "Harassment Crimes in 2021",
    subtitle = "State-wise distribution"
  ) +
  theme(
    legend.position = c(0.6,0.2),
    legend.key.size = unit(0.4, "cm"),
    legend.text = element_text(size = 7)
  ) -> plot_hrsmt


india_map_state_new |>
  ggplot() +
  geom_sf(aes(fill = `Sexual Harassment`), color = "black") +
  scale_fill_viridis_c(option = "plasma", na.value = "grey50") +
  theme_void() +
  labs(
    title = "Sexual Harassment Crimes in 2021",
    subtitle = "State-wise distribution"
  ) +
  theme(
    legend.position = c(0.6,0.2),
    legend.key.size = unit(0.4, "cm"),
    legend.text = element_text(size = 7)
  ) -> plot_sexhrsmt


india_map_state_new |>
  ggplot() +
  geom_sf(aes(fill = `POCSO`), color = "black") +
  scale_fill_viridis_c(option = "plasma", na.value = "grey50") +
  theme_void() +
  labs(
    title = "Crimes on Children in 2021",
    subtitle = "State-wise distribution"
  ) +
  theme(
    legend.position = c(0.6,0.2),
    legend.key.size = unit(0.4, "cm"),
    legend.text = element_text(size = 7)
  ) -> plot_chld


india_map_state_new |>
  ggplot() +
  geom_sf(aes(fill = `Sexual Violence`), color = "black") +
  scale_fill_viridis_c(option = "plasma", na.value = "grey50") +
  theme_void() +
  labs(
    title = "Rape Crimes in 2021",
    subtitle = "State-wise distribution"
  ) +
  theme(
    legend.position = c(0.6,0.2),
    legend.key.size = unit(0.4, "cm"),
    legend.text = element_text(size = 7)
  ) -> plot_rape

india_map_state_new |>
  ggplot() +
  geom_sf(aes(fill = `Cyber Crime`), color = "black") +
  scale_fill_viridis_c(option = "plasma", na.value = "grey50") +
  theme_void() +
  labs(
    title = "Cyber Crimes in 2021",
    subtitle = "State-wise distribution"
  ) +
  theme(
    legend.position = c(0.6,0.2),
    legend.key.size = unit(0.4, "cm"),
    legend.text = element_text(size = 7)
  ) -> plot_cc


combined_plot2 <- (plot_dv | plot_hrsmt | plot_sexhrsmt) / (plot_chld | plot_rape | plot_cc)

combined_plot2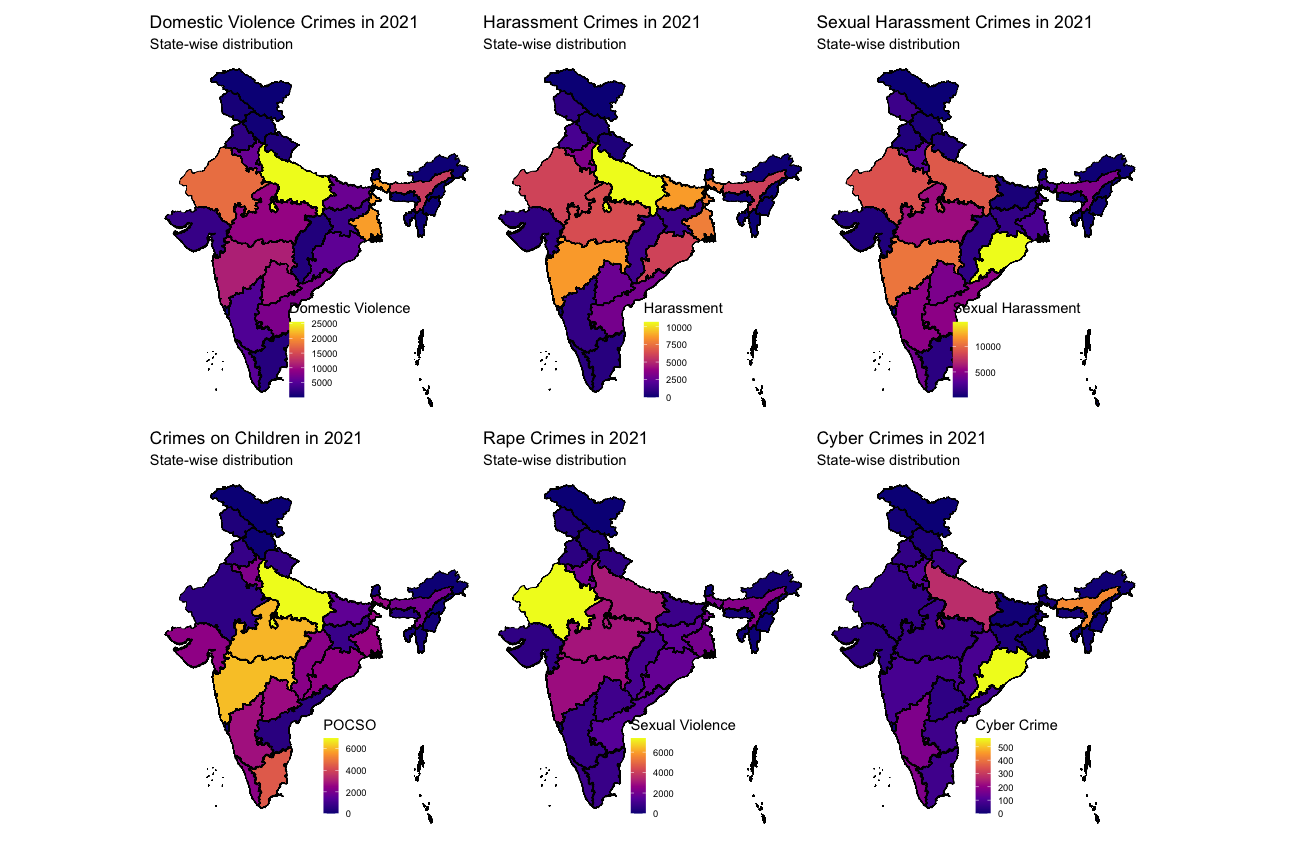
# Plot 3B  Plots

india_map_state_new_pc |>
  ggplot() +
  geom_sf(aes(fill = `Domestic Violence`), color = "black") +
  scale_fill_viridis_c(option = "plasma", na.value = "grey50") +
  theme_void() +
  labs(
    title = "Domestic Violence Crimes in 2021",
    subtitle = "Crimes Per 1 Lac of Population"
  ) +
  theme(
    legend.position = c(0.6,0.2),
    legend.key.size = unit(0.4, "cm"),
    legend.text = element_text(size = 7)
  ) -> plot_dv_pc

india_map_state_new_pc |>
  ggplot() +
  geom_sf(aes(fill = `Harassment`), color = "black") +
  scale_fill_viridis_c(option = "plasma", na.value = "grey50") +
  theme_void() +
  labs(
    title = "Harassment Crimes in 2021",
    subtitle = "Crimes Per 1 Lac of Population"
  ) +
  theme(
    legend.position = c(0.6,0.2),
    legend.key.size = unit(0.4, "cm"),
    legend.text = element_text(size = 7)
  ) -> plot_hrsmt_pc


india_map_state_new_pc |>
  ggplot() +
  geom_sf(aes(fill = `Sexual Harassment`), color = "black") +
  scale_fill_viridis_c(option = "plasma", na.value = "grey50") +
  theme_void() +
  labs(
    title = "Sexual Harassment Crimes in 2021",
    subtitle = "Crimes Per 1 Lac of Population"
  ) +
  theme(
    legend.position = c(0.6,0.2),
    legend.key.size = unit(0.4, "cm"),
    legend.text = element_text(size = 7)
  ) -> plot_sexhrsmt_pc


india_map_state_new_pc |>
  ggplot() +
  geom_sf(aes(fill = `POCSO`), color = "black") +
  scale_fill_viridis_c(option = "plasma", na.value = "grey50") +
  theme_void() +
  labs(
    title = "Crimes on Children in 2021",
    subtitle = "Crimes Per 1 Lac of Population"
  ) +
  theme(
    legend.position = c(0.6,0.2),
    legend.key.size = unit(0.4, "cm"),
    legend.text = element_text(size = 7)
  ) -> plot_chld_pc


india_map_state_new_pc |>
  ggplot() +
  geom_sf(aes(fill = `Sexual Violence`), color = "black") +
  scale_fill_viridis_c(option = "plasma", na.value = "grey50") +
  theme_void() +
  labs(
    title = "Rape Crimes in 2021",
    subtitle = "Crimes Per 1 Lac of Population"
  ) +
  theme(
    legend.position = c(0.6,0.2),
    legend.key.size = unit(0.4, "cm"),
    legend.text = element_text(size = 7)
  ) -> plot_rape_pc

india_map_state_new_pc |>
  ggplot() +
  geom_sf(aes(fill = `Cyber Crime`), color = "black") +
  scale_fill_viridis_c(option = "plasma", na.value = "grey50") +
  theme_void() +
  labs(
    title = "Cyber Crimes in 2021",
    subtitle = "Crimes Per 1 Lac of Population"
  ) +
  theme(
    legend.position = c(0.6,0.2),
    legend.key.size = unit(0.4, "cm"),
    legend.text = element_text(size = 7)
  ) -> plot_cc_pc


combined_plot2_pc <- (plot_dv_pc | plot_hrsmt_pc | plot_sexhrsmt_pc) / (plot_chld_pc | plot_rape_pc | plot_cc_pc)

combined_plot2_pc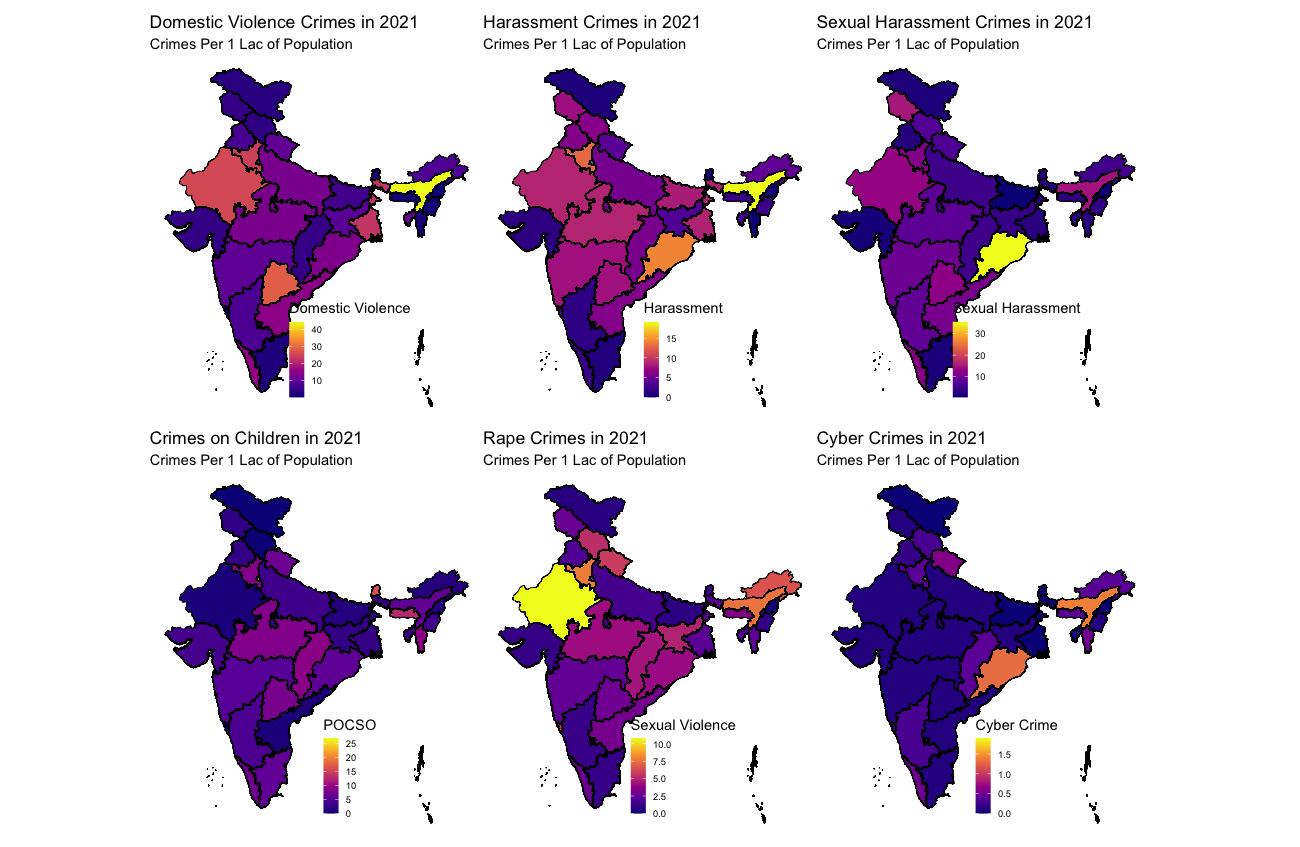
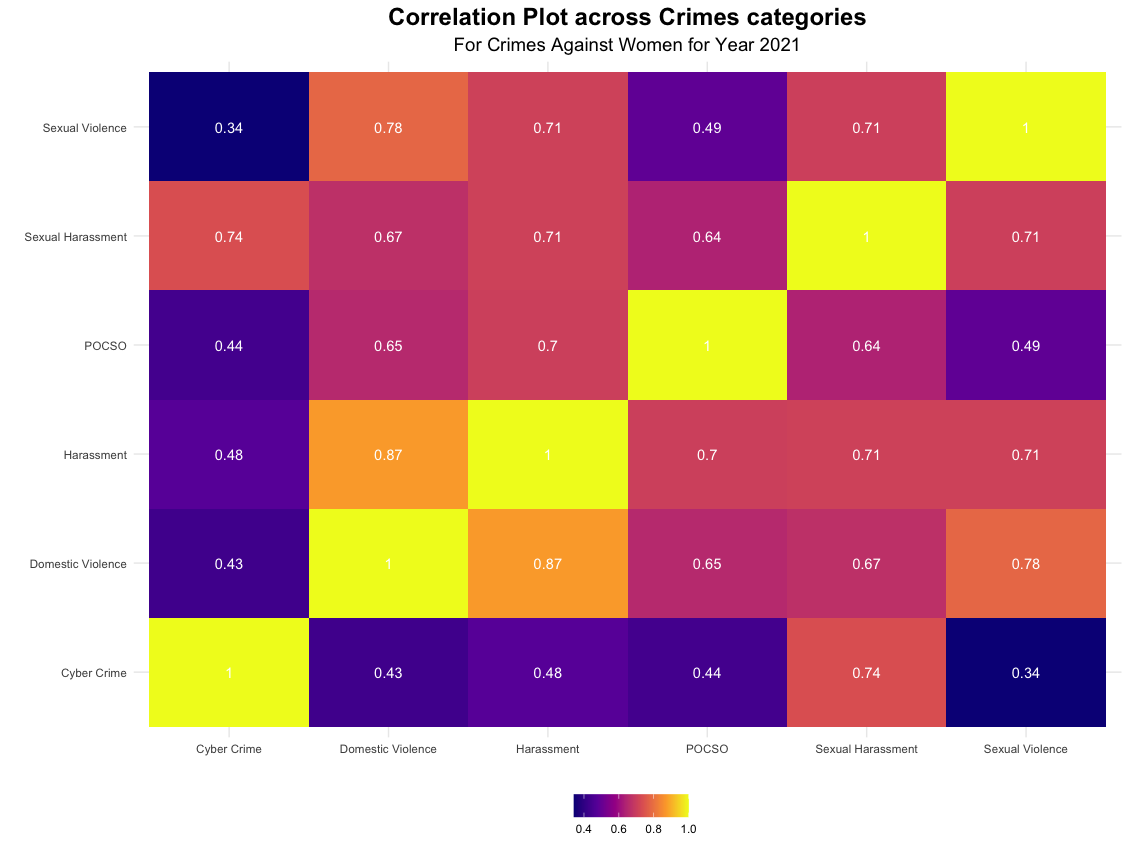
# Plot4 - Correlation Chart

cor_crime_data = as.data.frame(as.table(cor(Crime_Data_21_State_Summary[,c(2:7)])))

cor_crime_data |>
  ggplot(aes(x = Var1, y = Var2, fill = Freq)) +
  geom_tile() +
  scale_fill_viridis_c(option = "plasma", na.value = "grey50") +
  theme_minimal() +
    labs(
    title = "Correlation Plot across Crimes categories",
    subtitle = "For Crimes Against Women for Year 2021",
    x = "",
    y = "",
    fill = ""
  ) +
  geom_text(aes(label=round(Freq,2)),color="white") +
  theme(
    legend.position = "bottom",
    plot.title = element_text(hjust = 0.5, size = 18, face = "bold"),
    plot.subtitle = element_text(hjust = 0.5, size = 14)
) 