import pandas as pd
from dfply import *
from plotnine import *
import ssl0. Loading Libraries
1. Data Loading
## adding below ssl line as it is giving ssl error locally in my machine
ssl._create_default_https_context = ssl._create_unverified_context

groundhogs = pd.read_csv('https://raw.githubusercontent.com/rfordatascience/tidytuesday/master/data/2024/2024-01-30/groundhogs.csv')
predictions = pd.read_csv('https://raw.githubusercontent.com/rfordatascience/tidytuesday/master/data/2024/2024-01-30/predictions.csv')
2. Data Transformation
merged_df = pd.merge(predictions, groundhogs, on="id", how="left")


predictions_groundhog = (merged_df >>
                         select(~X.description, ~X.details, ~X.source, ~X.current_prediction,
                                ~X.image, ~X.slug, ~X.name, ~X.predictions_count, ~X.active) >>
                         filter_by(X.is_groundhog == True))
3. Plotting
3.1. Consensus of Groundhogs YonY
Code for Density Plot of Consensus
plot = (predictions_groundhog >>
        filter_by(X.shadow.notna()) >>
        ggplot(aes(x='year', color='shadow')) +
        geom_density() +
        scale_color_manual(name='Prediction',
                           labels=['Early Spring', 'Long Winter'],
                           values=['#8B4513', '#0000CD']) +
        theme_minimal(base_size=14) +
        theme(legend_position=(0.5, 0.5)) +
        theme(figure_size=(6,4)) +
        labs(title='Consensus of Groundhogs YoY'))

print(plot)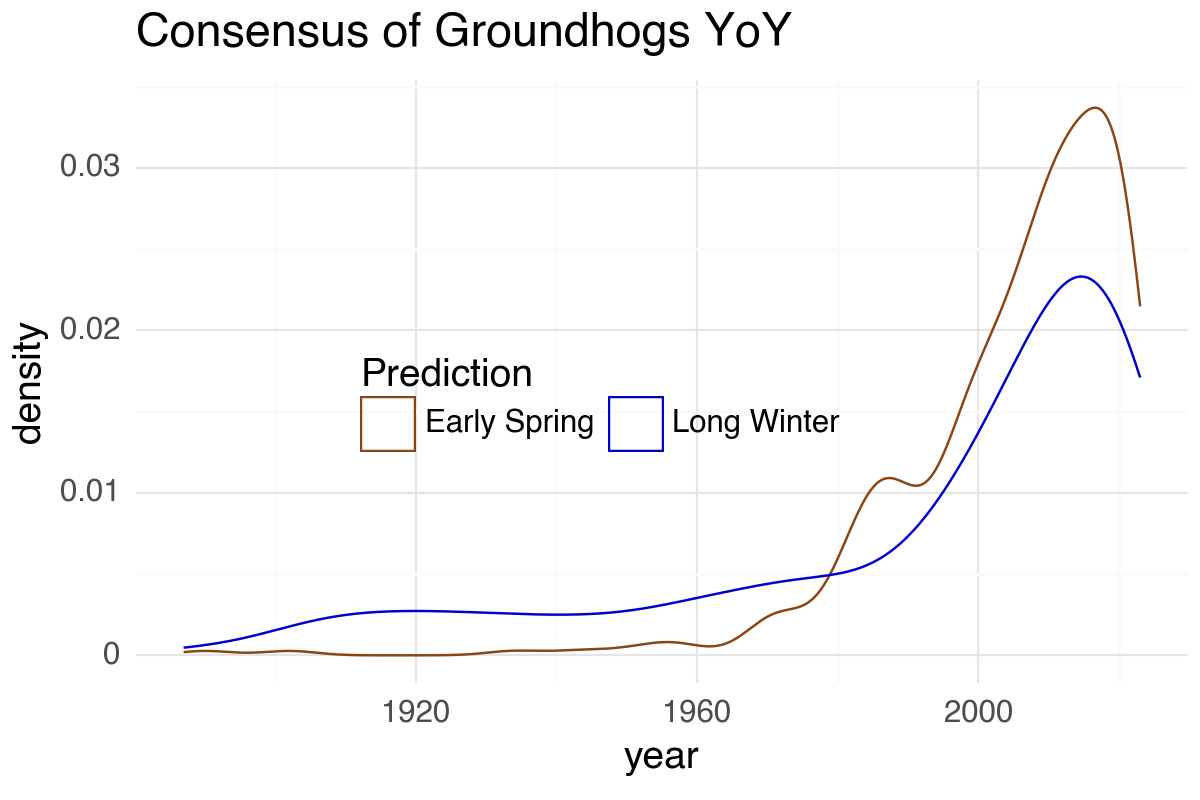
3.2. Count of GroundHogs YonY
Code for Line Plot of Groundhogs
plot = (predictions_groundhog >>
        filter_by(X.shadow.notna()) >>
        group_by(X.year) >>
        summarize(n = n(X.year)) >>
        ggplot(aes(x='year', y='n')) +
        geom_line() +
        theme_minimal() +
        labs(x='year', y='number of groundhogs', title='Count of Groundhogs by Year'))

print(plot)
3.3. Consensus of GroundHogs YonY by ShortName
Code for Consensus Plot of Groundhogs by ShortName
plot = (predictions_groundhog >>
        filter_by(X.shadow.notna()) >>
        ggplot(aes(x='year', color='shadow')) +
        geom_histogram() +
        labs(title='Consensus of Groundhogs YoY') +
        facet_wrap('~shortname') +
        scale_color_manual(name='Prediction',
                           labels=['Early Spring', 'Long Winter'],
                           values=['#8B4513', '#0000CD']) +
        theme_minimal(base_size = 14) +
        theme(figure_size=(20,12))
                           )

print(plot)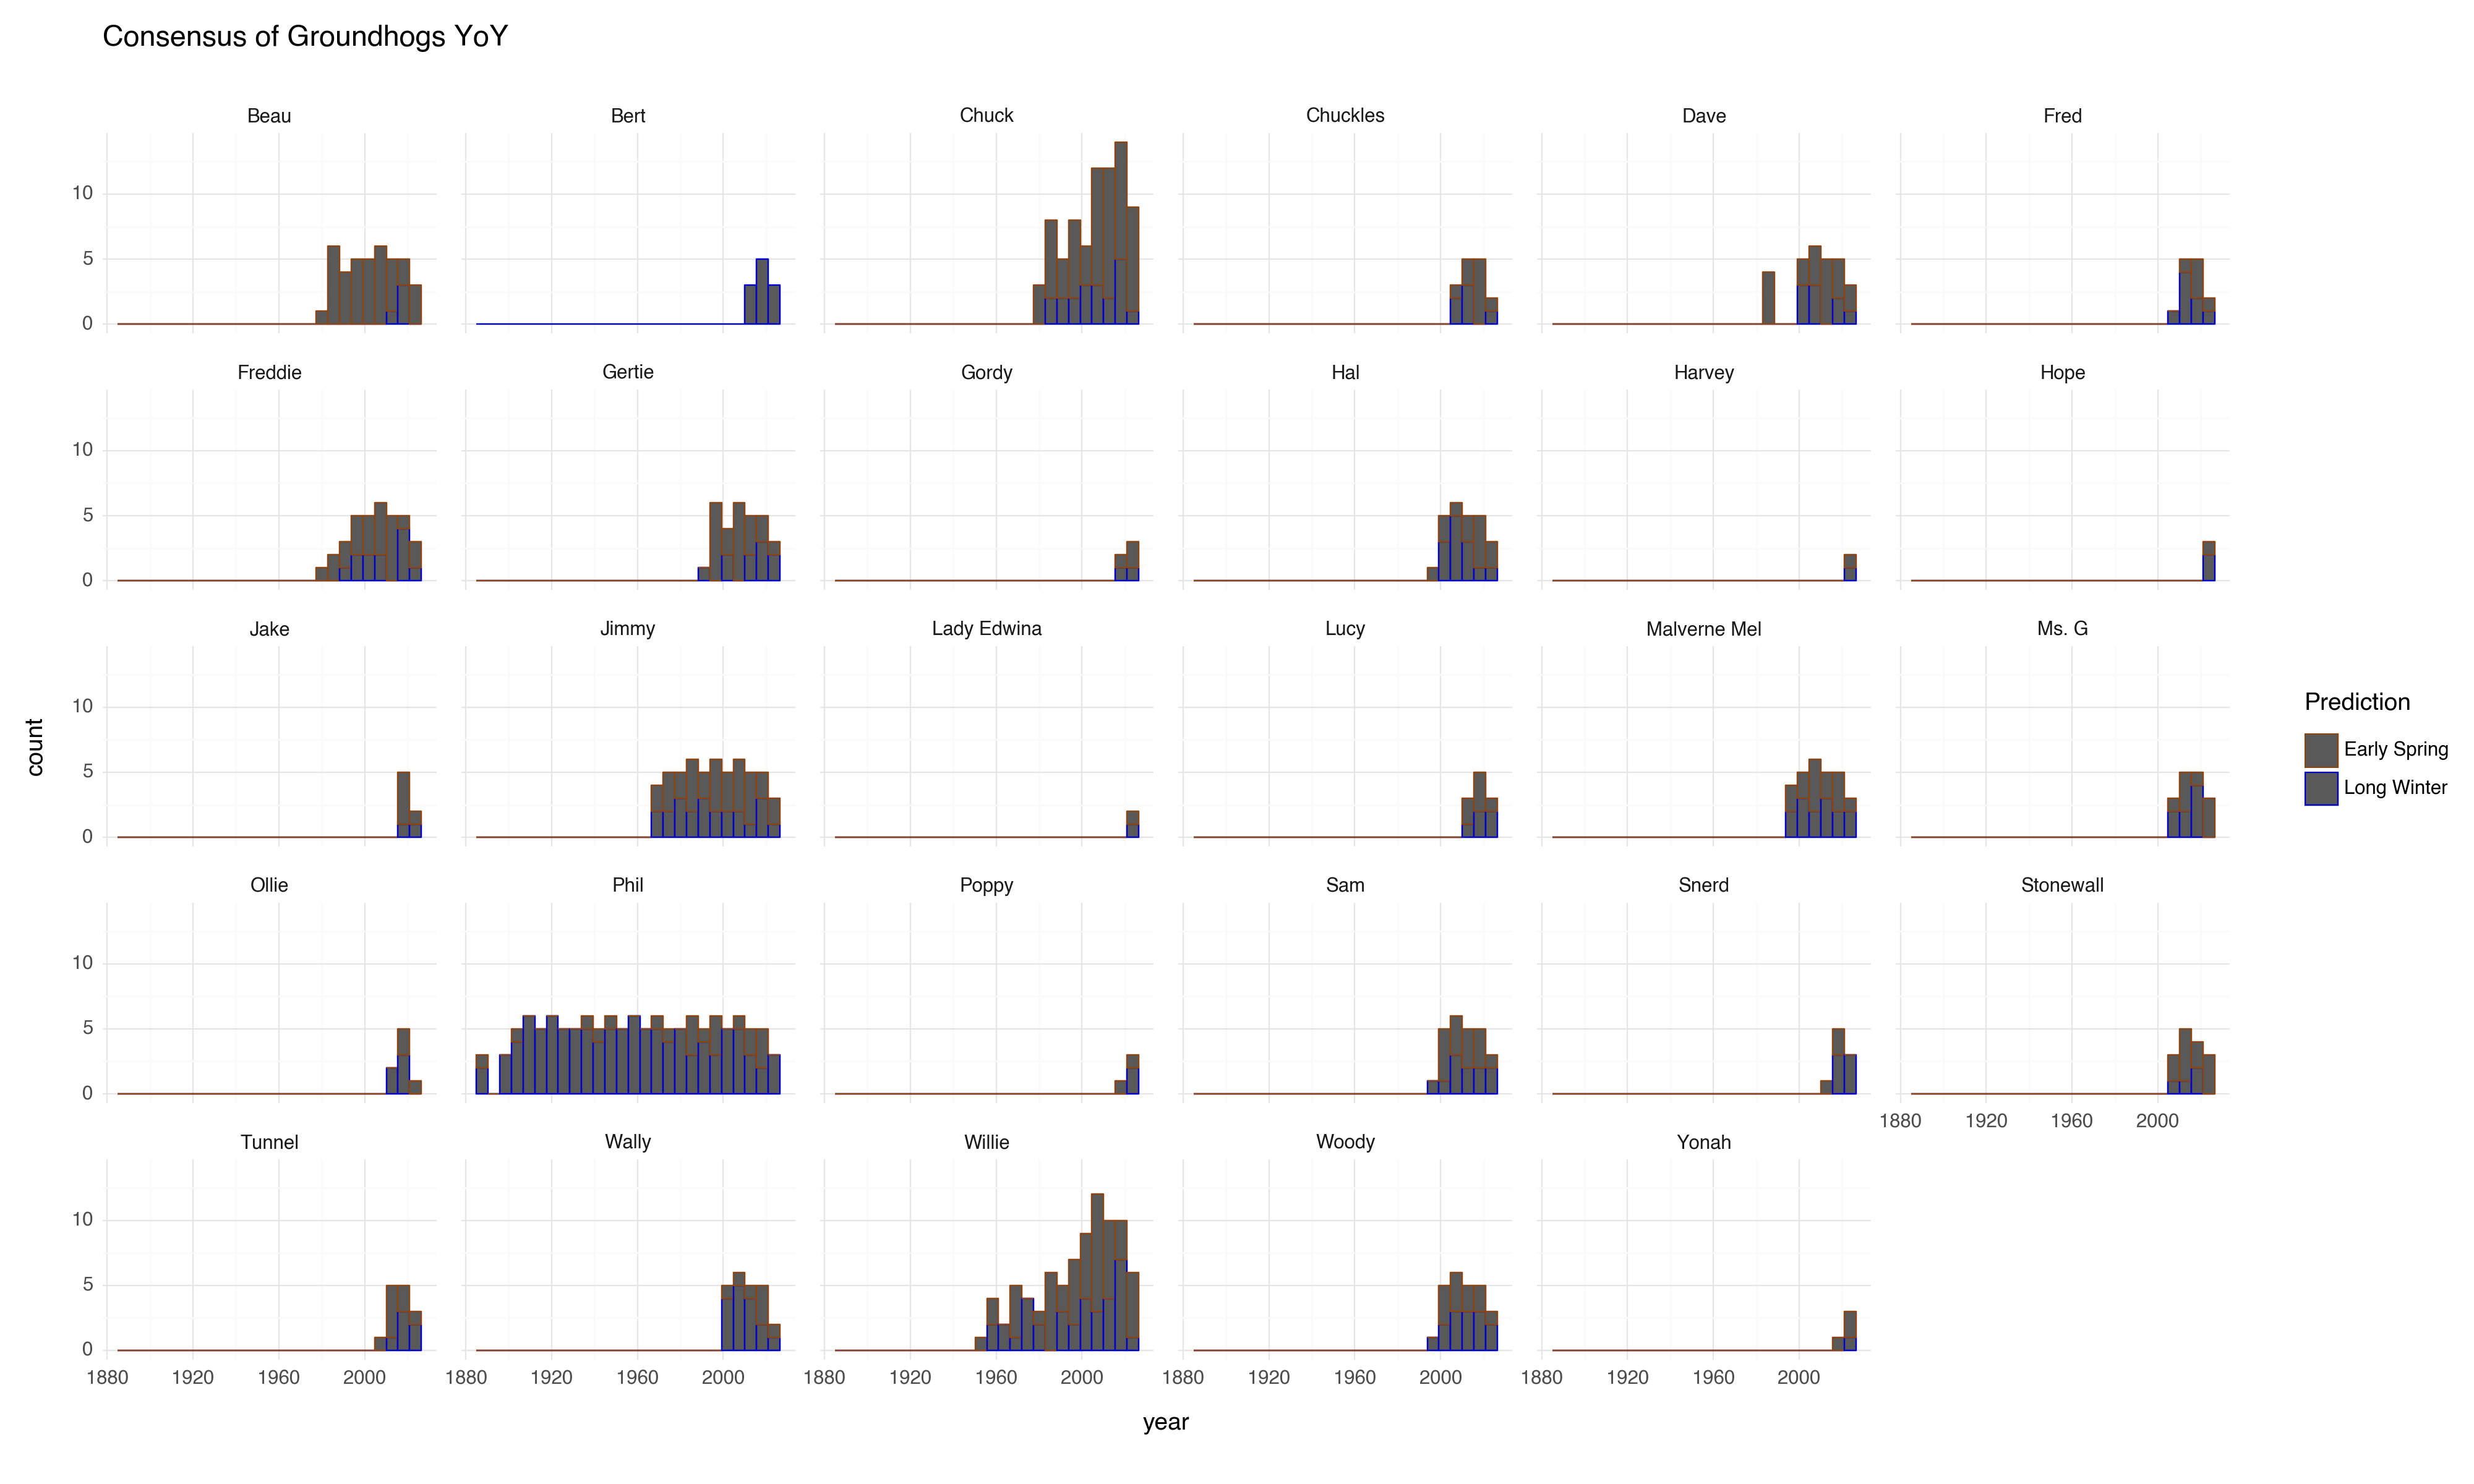
I believe this is a simplified representation of the consensus to gain initial insights.
Considering the number of groundhogs included in the observational study, the majority predicted an early spring.
However, since we currently lack weather data, we are unable to cross-verify which predictions were accurate.
With the exception of
Phil, most others forecasted an early spring.