Tidy Tuesday

A weekly data challenge · R & Python
One dataset a week, turned into a chart.
Every Tuesday the R for Data Science community shares a new dataset. These are my answers: from a first line plot in Python to custom backgrounds, choropleth maps, animations and a full dashboard in R. Each one comes with the code.
Recent charts
 R
Week of 27 Oct 2026
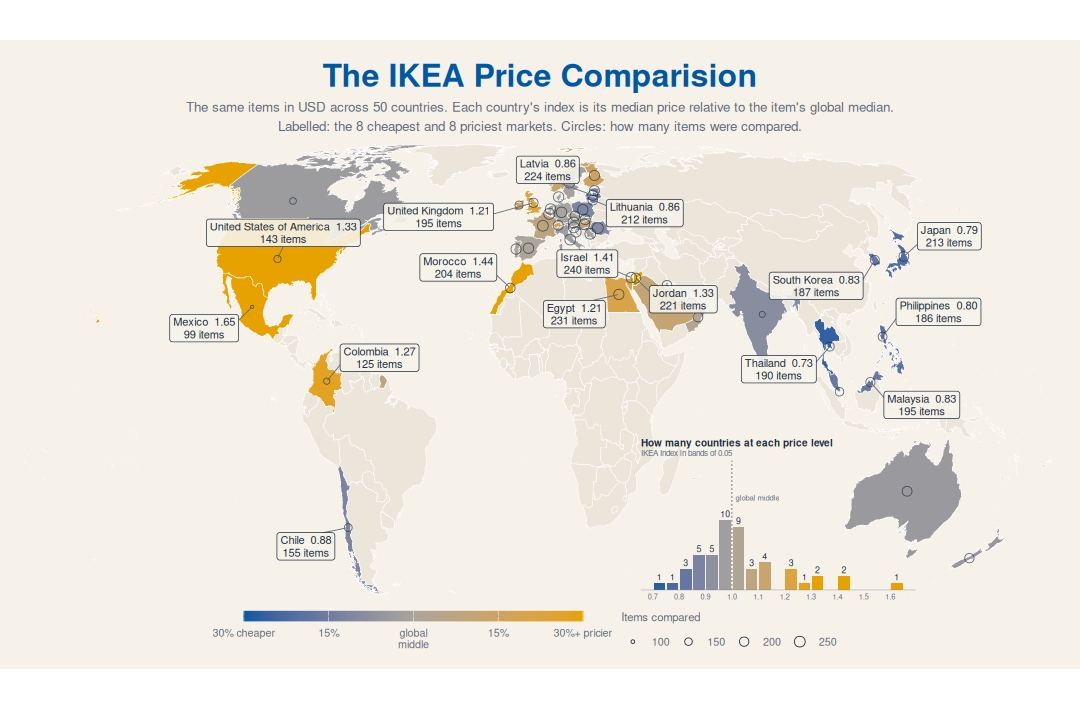
IKEA Prices and Affordability
A cheaper IKEA price in one country doesn't mean IKEA is more affordable there.
mapsdot plot
 R
Week of 20 Oct 2026
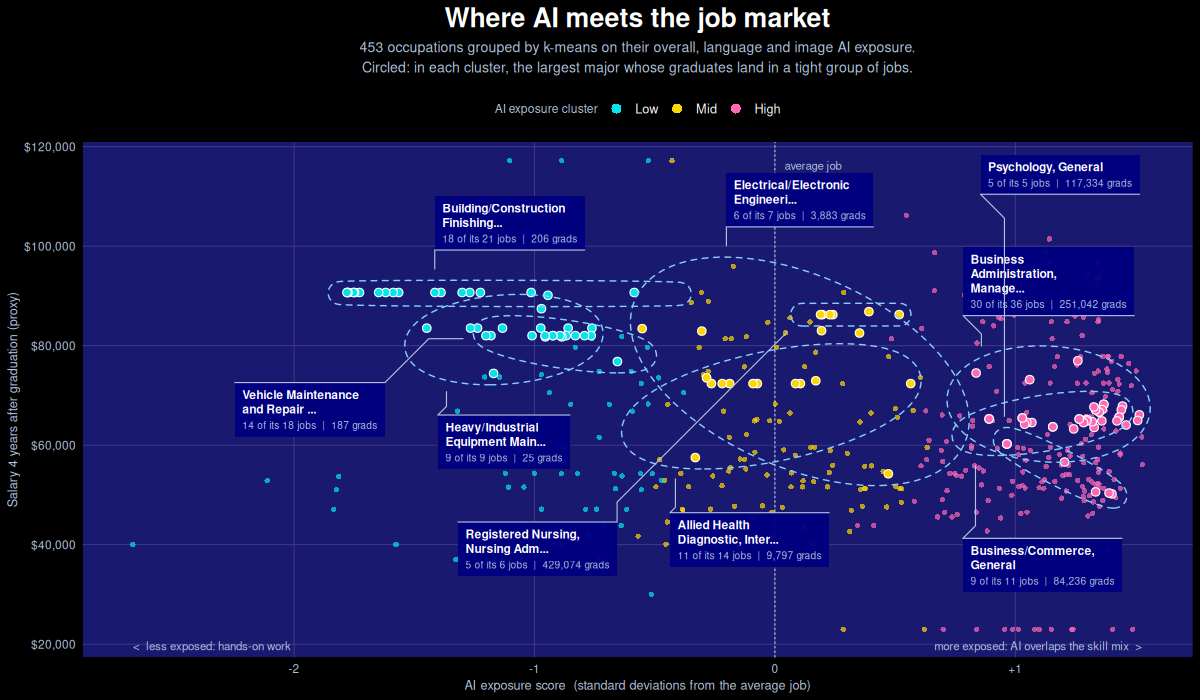
College Majors and AI Exposure
The jobs least exposed to AI pay the most, yet only about 1 in 40 graduates heads toward them.
scatter plotclusteringtable
 R
Week of 29 Oct 2024
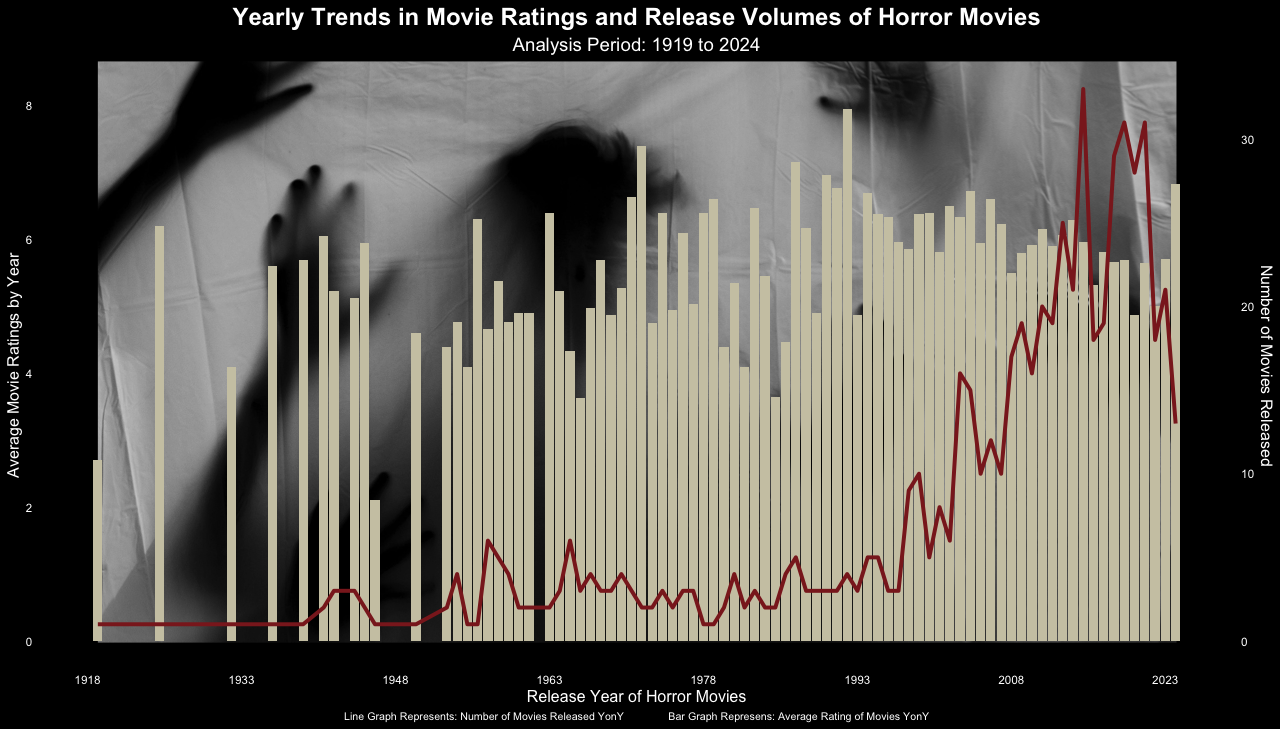
Monster Movies
Horror films have boomed since 2000, and the good ones with them.
dual axisbar chart
 R
Week of 14 Nov 2023
Diwali Sales Dashboard
Who shopped for Diwali, what they bought and where, in one Quarto dashboard.
dashboardmaps
 R
Bonus dataset
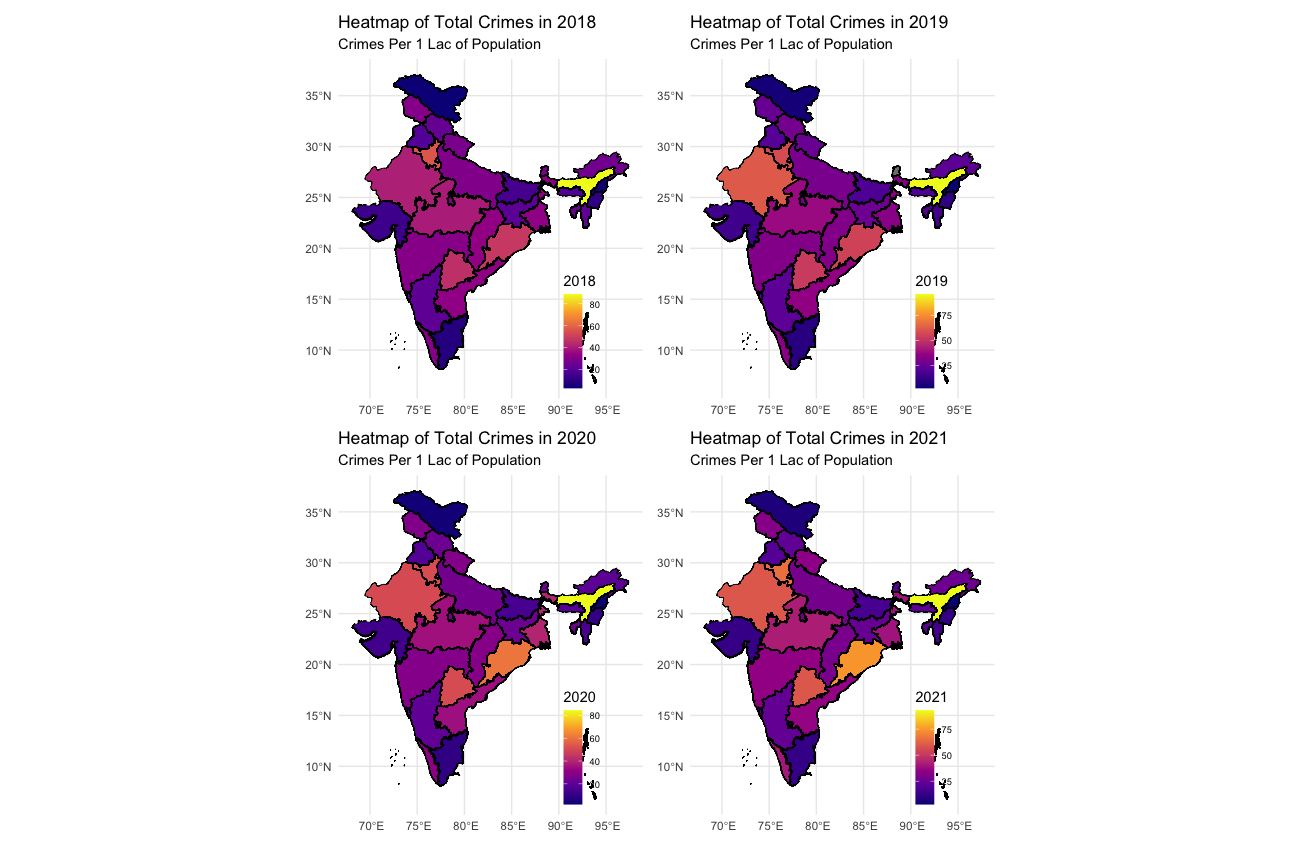
Crimes Against Women in India
District-level crime data mapped state by state, in absolute numbers and per lakh of population.
mapsbonus
 R
Week of 21 May 2024
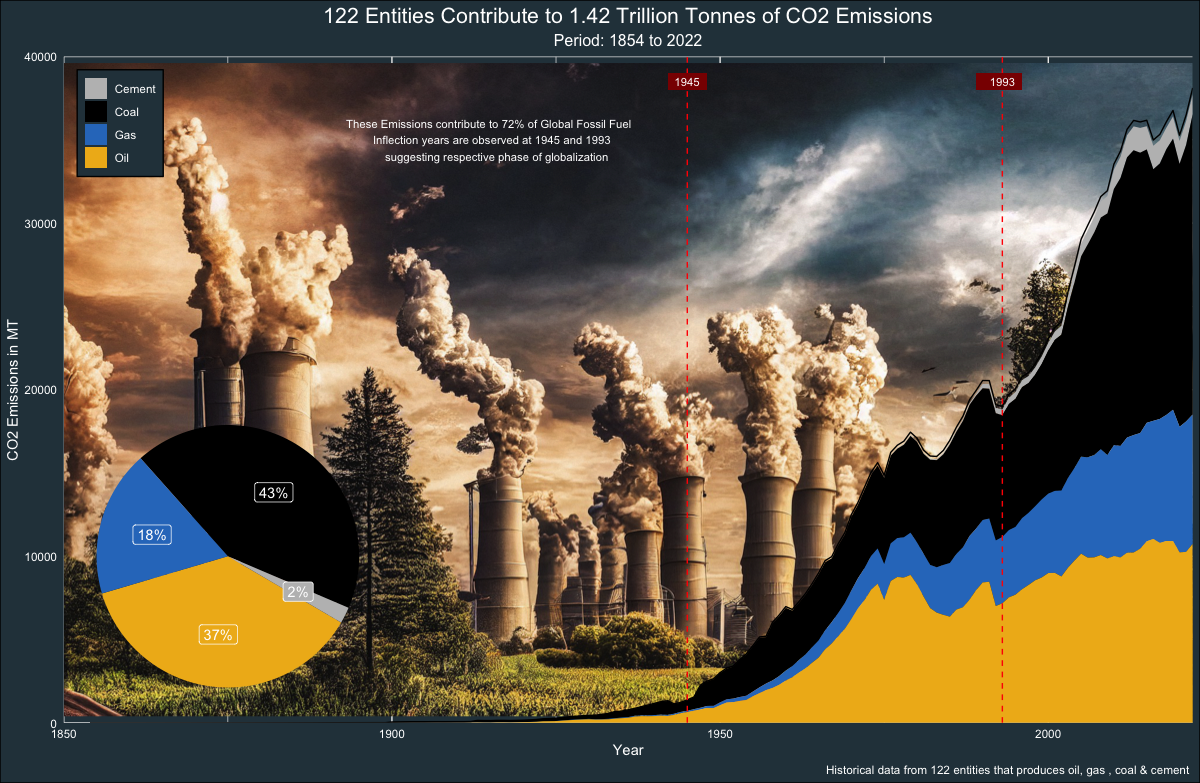
Carbon Majors Emissions
1.42 trillion tonnes of CO₂ from the world's largest producers, by commodity and owner.
area chartcustom background
No matching items
By email
Get the next chart in your inbox
One email when a new week is published, with the chart and the takeaway. No other mail, and you can unsubscribe anytime.
More from Arun
Essays, teaching and study notes, on my other sites.